Getting started as a developer
Assumptions
- You already have an account in the Platform
- You are a part of an Organization
- You have a Role that allows you to access the DevOps section of the Platform (view projects and environments), to access one or more Projects (and their Environments) and to execute certain actions on those Environments (notably, deploying code). We’ll refer to this as ‘Developer’ from now on.
In this tutorial…
We’ll show you:
- Where to find your user settings
- How to set up an SSH key, so you can check out Projects
- Where to find your Projects and their Environments
- What actions and information is available in those Projects and their Environments
Step 1: Log in
Warning:
If you have recently been granted an account on the Platform, you should have gotten an email asking you to confirm and log into your account.
Make sure to do so, as the first-time login link is only valid for 24 hours.
When trying to access the Platform directly, you will be greeted with a login screen.
Fill in your credentials and let’s go in.
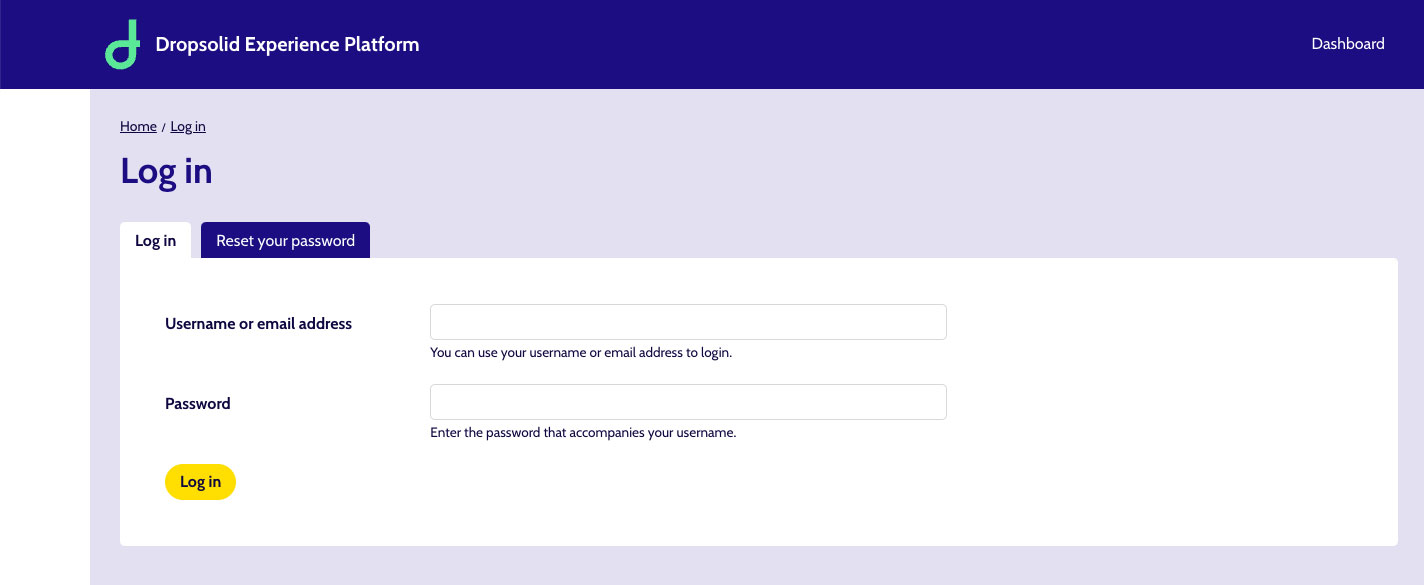
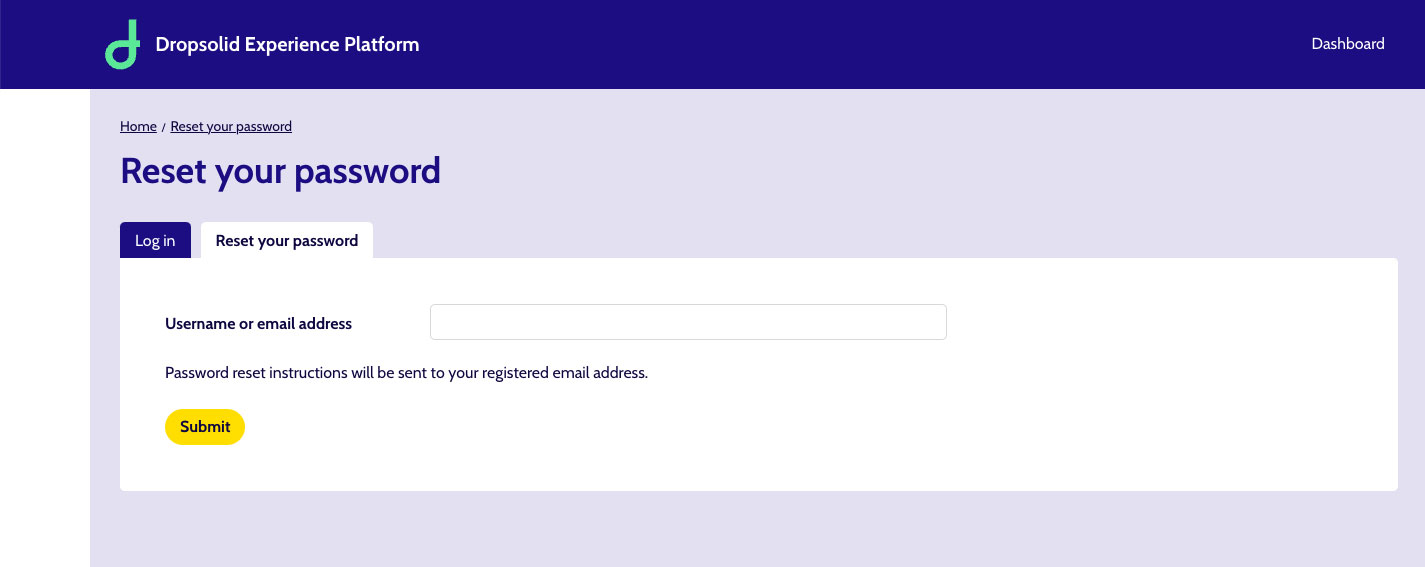
If you’ve lost your password, you can open the ‘Reset your password’ tab. There you can use your username or email address to request a reset.
If either of these are known to the system, you should get an email with further instructions.
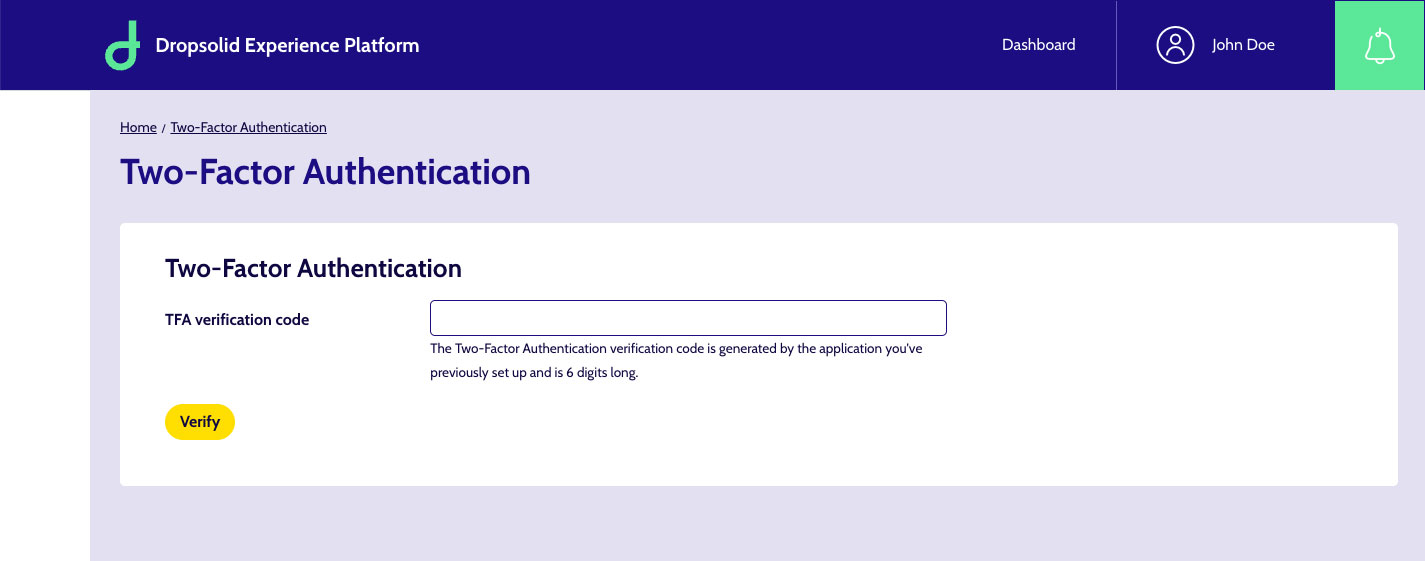
Now, if your account already has Two-Factor Authentication (TFA) set up, you will be greeted by an additional screen, asking you to enter the verification code.
If you don’t see this screen, no worries, we’ll discuss the TFA setup later.
Step 2: User settings
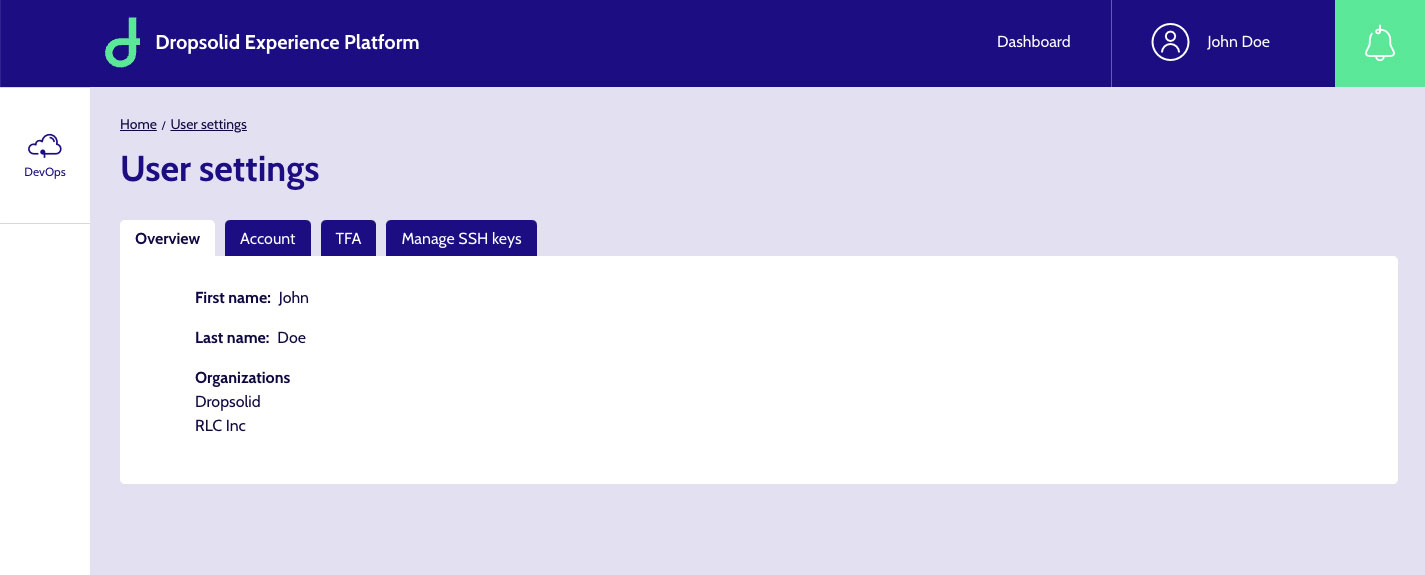
When logged in, you are directed to your ‘User Settings’ page, where you can find more information about your account and manage your SSH keys.
Overview
In the ‘Overview’ tab you can see what Organizations you are a part of. This will come up again when accessing Projects.
Note: in future, we will also use this space to display the Roles you occupy within these organizations.
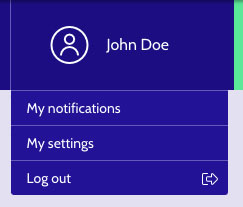
Incidentally, you can find your way back to the User Settings from any page, by hovering or clicking your user name in the header, to reveal a dropdown menu. The ‘My Settings’ item will lead you back here.
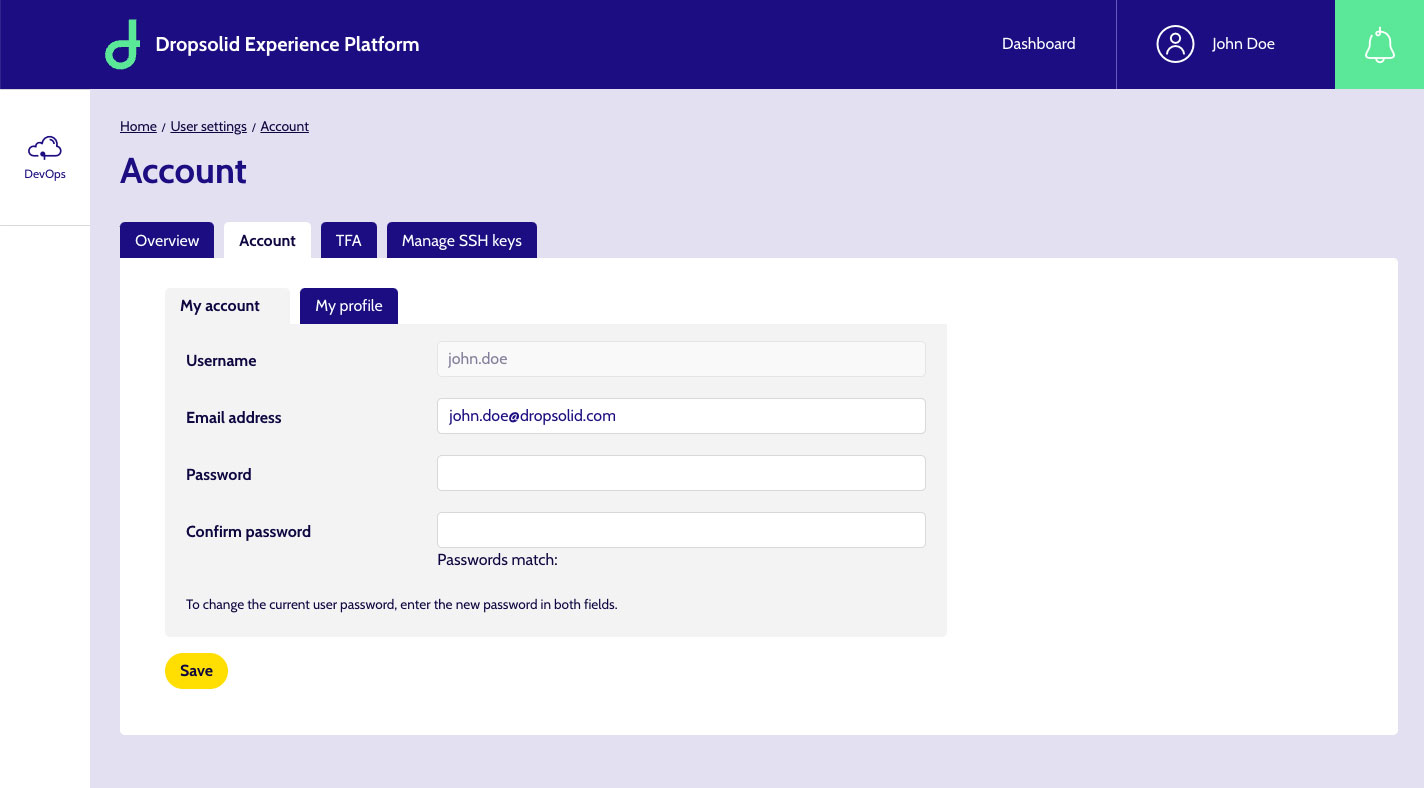
Account
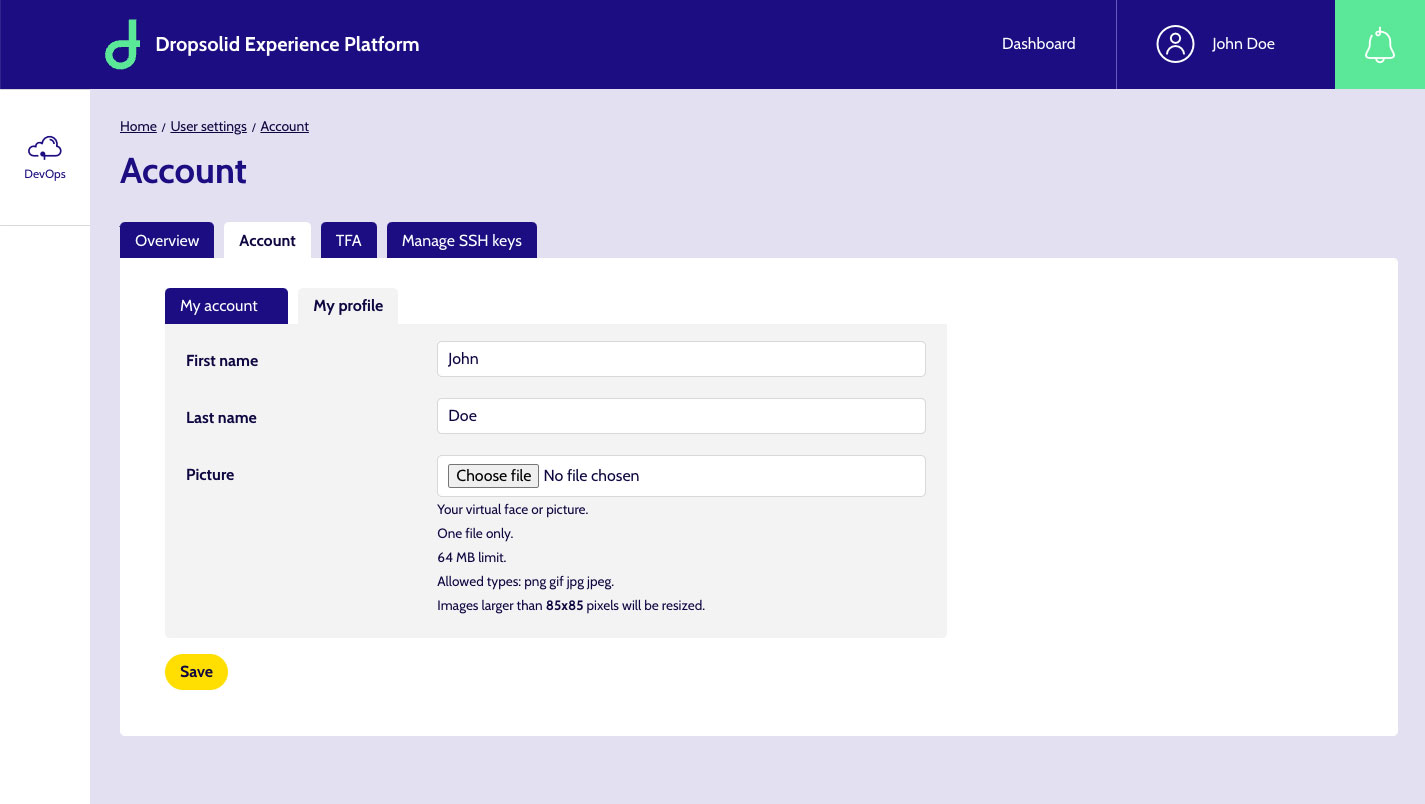
Moving on to the ‘Account’ tab, this is where you can modify your email address and password, as well as your full name.
Note: the picture is currently not used so you can leave it empty.
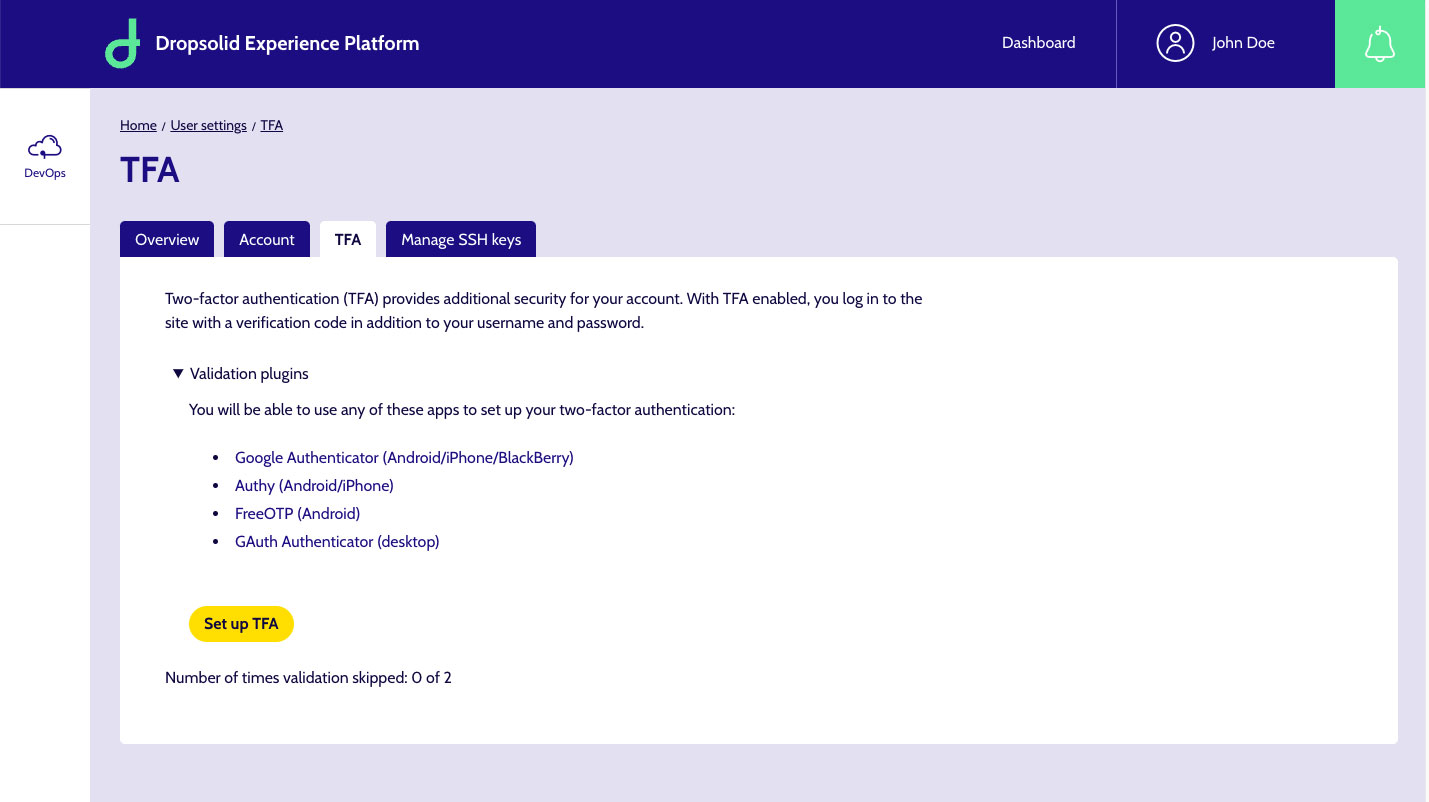
Two-Factor Authentication (TFA)
The next tab, lets you set up an extra layer of security. This is mandatory.
If you haven't set this up yet, you will be asked to do so now. This relies on the use of an Authentication app on a smartphone. So be sure to install one of the suggested options before proceeding.
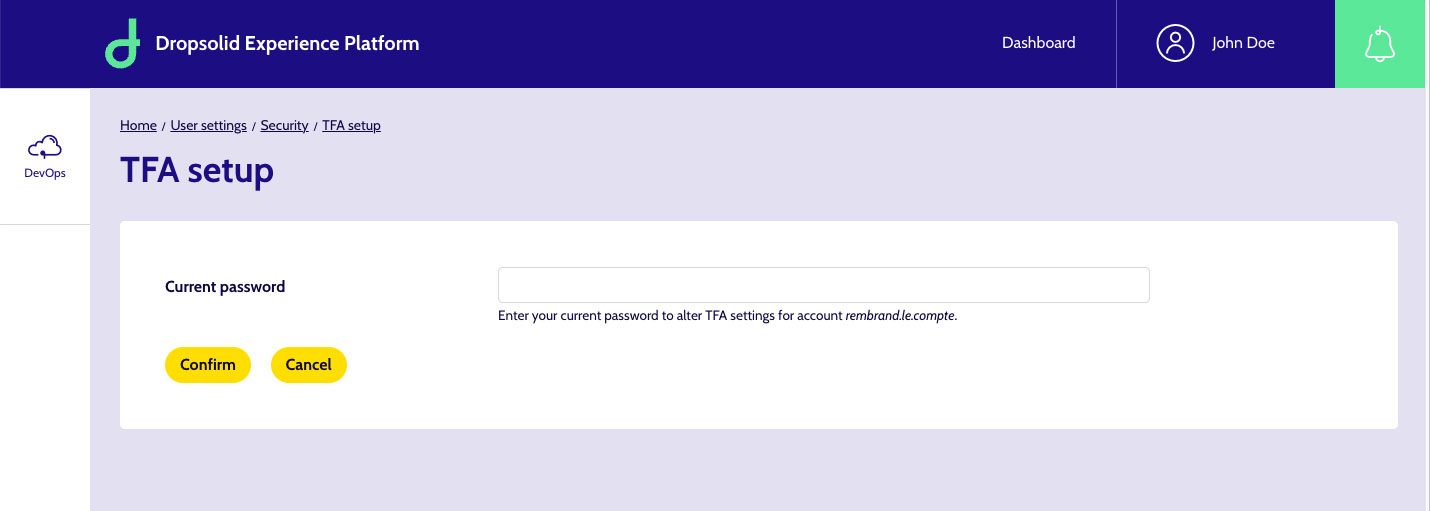
When starting the setup in the Platform, you will be asked to confirm your password again.
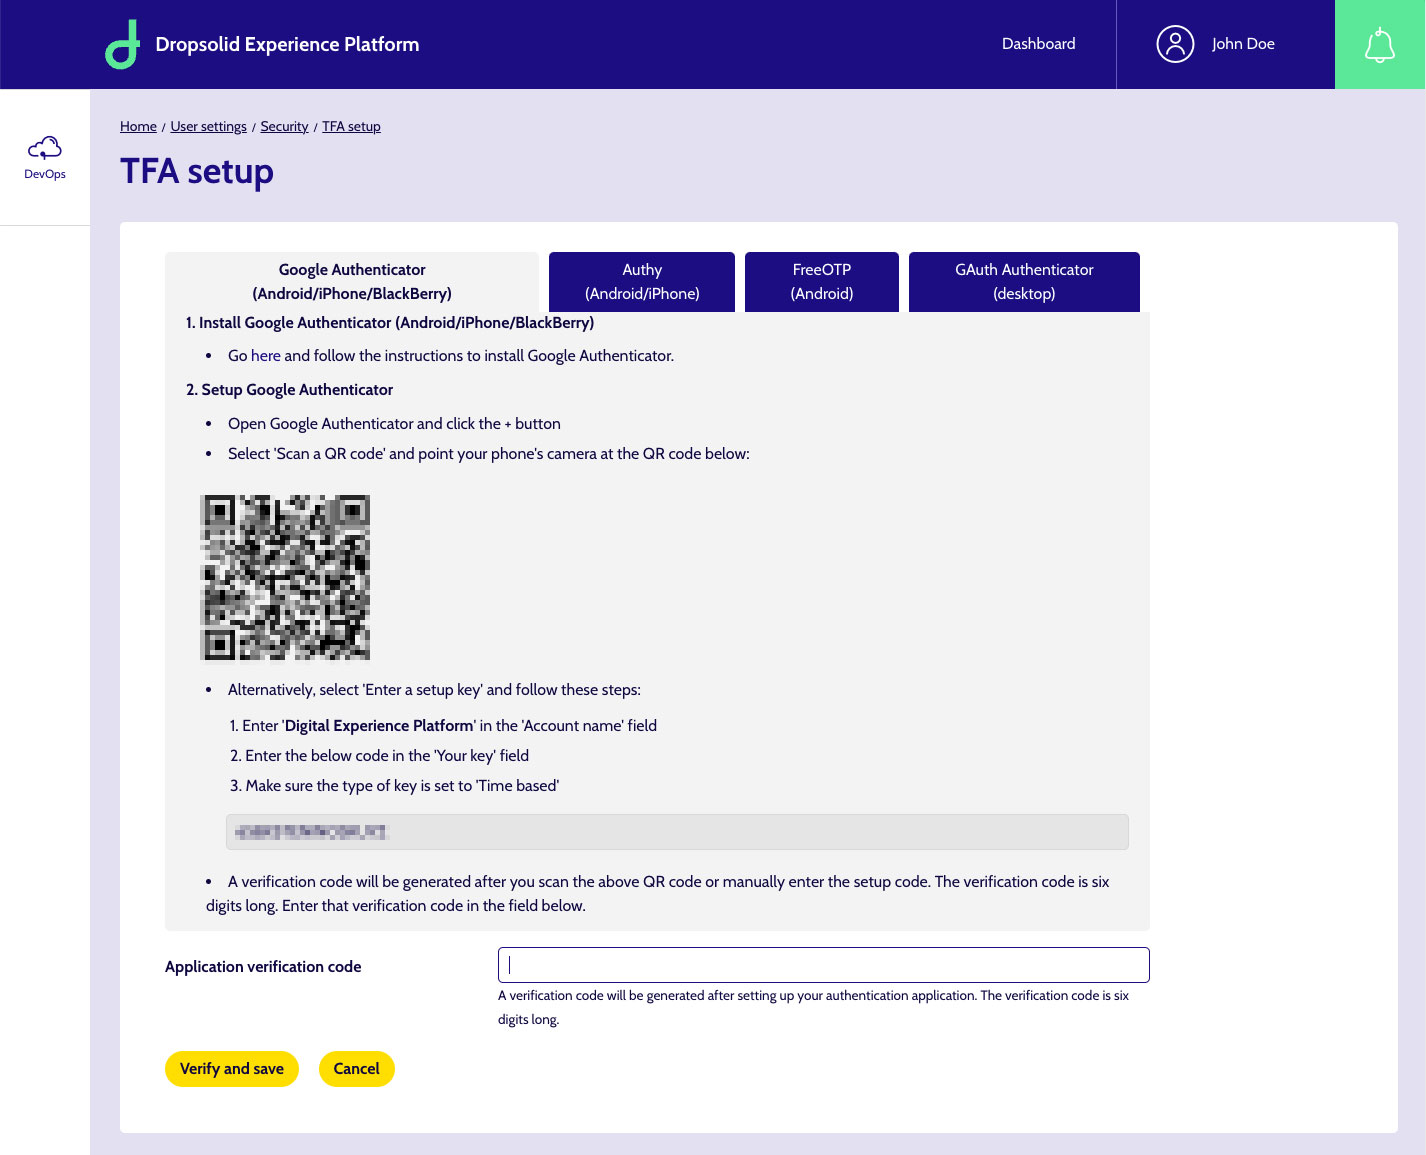
Afterwards, use your Authenticator app to scan the code or fill in the key manually.
Once you click ‘Verify and save’, you should be good to go.
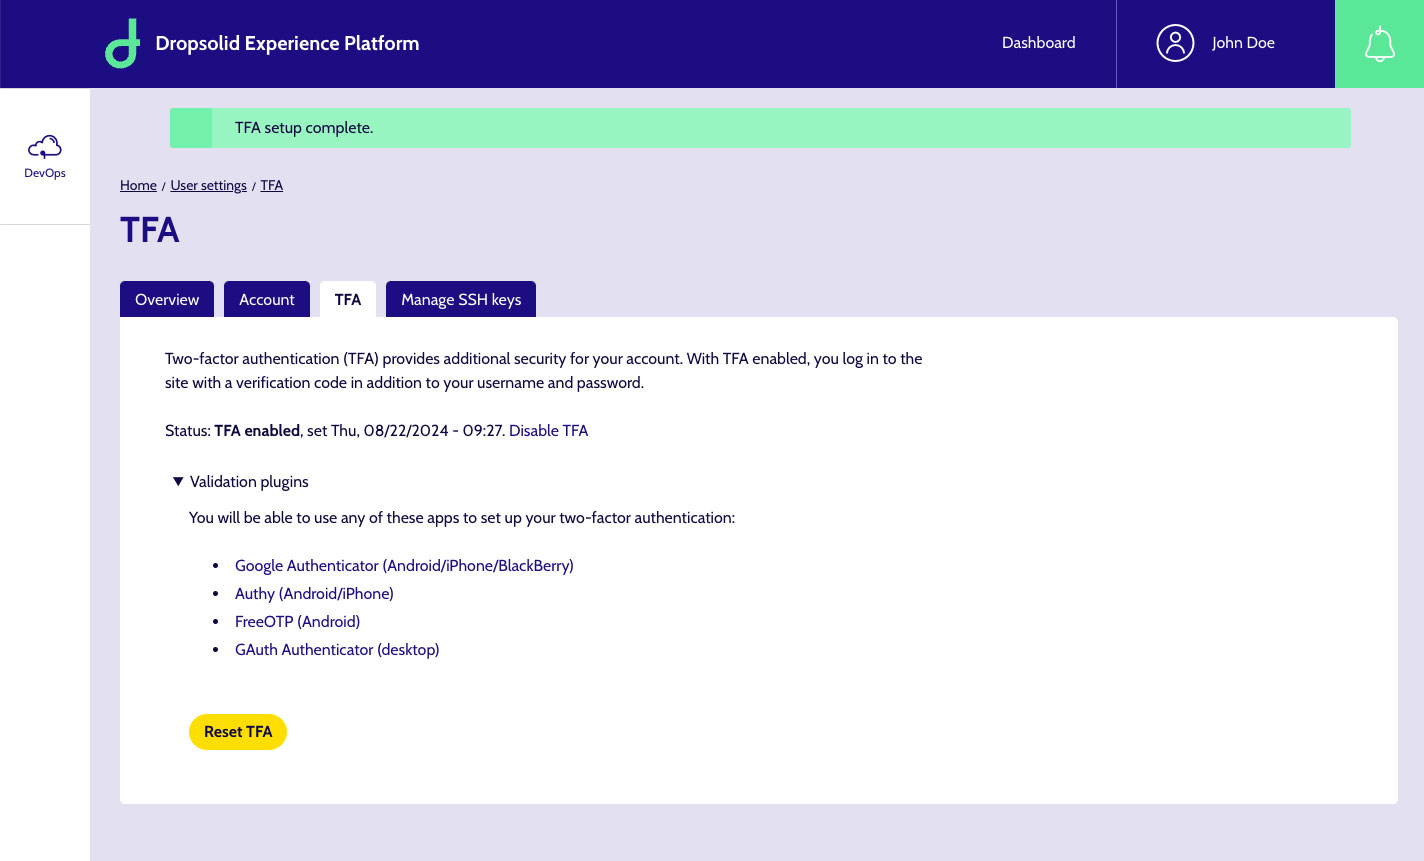
When you go back to the TFA tab, you will now see some information about the status and when it was set up.
If at some point you need to move to another Authentication app or you need to remove TFA, you can do so using the Reset RFA button at the bottom of the page.
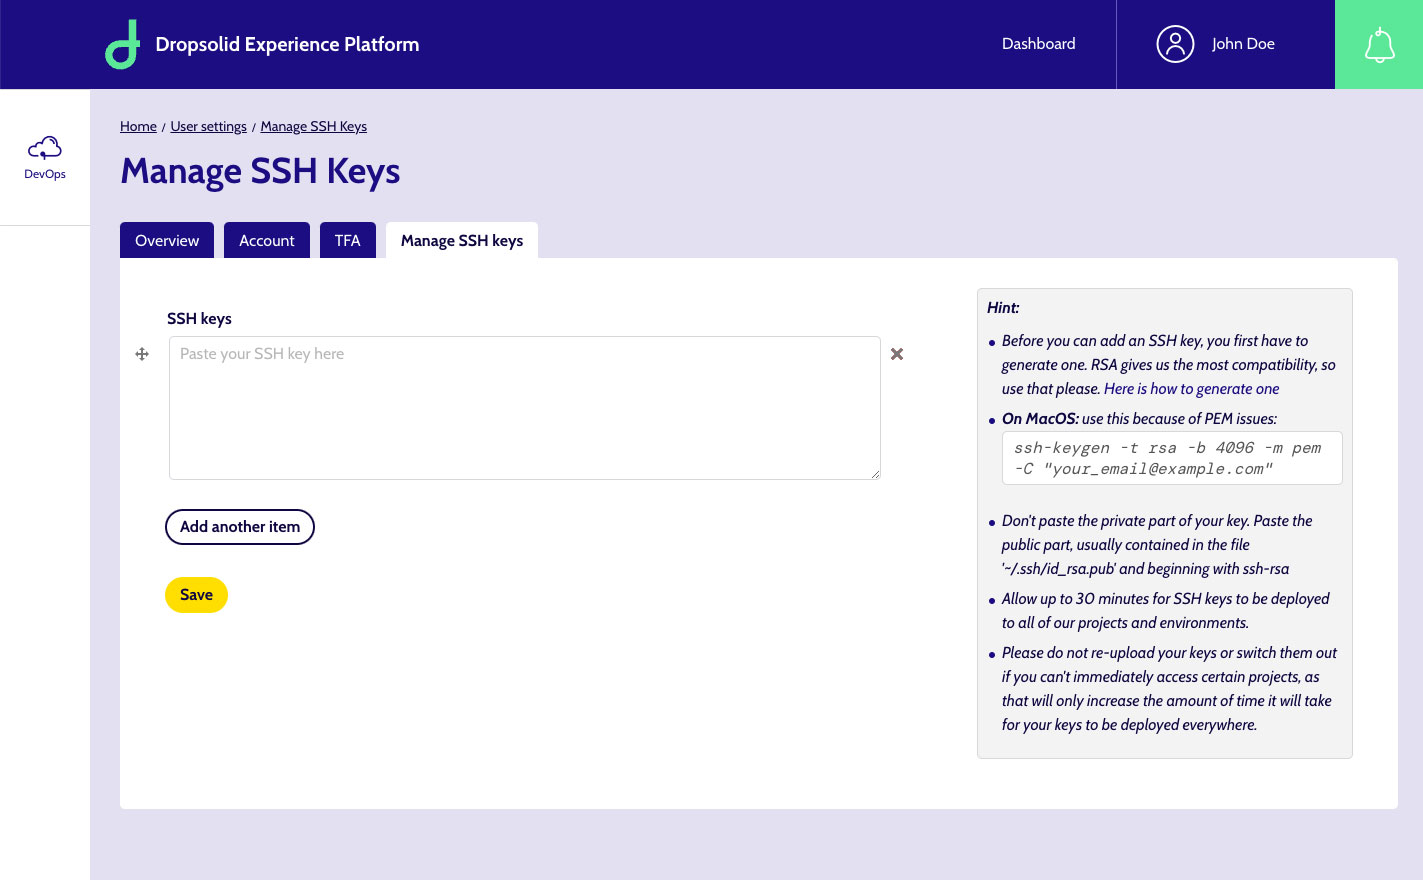
Manage SSH Keys
As a Developer, you need to be able to check out code repositories or push code to them.
If you are already familiar with working in Git, you’ll know that in order to allow your local computer to access those repositories, you need an SSH key.
This page offers you some information on how to do this.
Generating a key:
- You can find info about generating a key on your machine, in the Gitlab documentation.
- We recommend setting RSA as type, for compatibility reasons:
-t rsa - We’ve seen PEM issues with keys generated on MacOS, therefore we recommend setting PEM as a format when generating on a Mac:
-m pem - Set the number of bits for the key size to 4096:
-b 4096
Example command:
ssh-keygen \-t rsa \-b 4096 \-m pem \-C "[your\_email@example.com](mailto:your\_email@example.com)"
When you have your SSH key on your machine, find the public part (usually contained in the file '\~/.ssh/id_rsa.pub'), paste it into the `SSH Keys’ field and save your changes.
Things of note:
- Don't paste the private part of your key.
- Allow up to 30 minutes for SSH keys to be deployed to all of our projects and environments.
- Please do not re-upload your keys or switch them out if you can't immediately access certain projects, as that will only increase the amount of time it will take for your keys to be deployed everywhere.
Step 3: Find your Projects and Environments
When logged in, you can find your way to an overview of all the Projects (and their Environments) you have access to.
One way is by clicking on the ‘DevOps’ item in the left sidebar.
Or by going to the ‘Dashboard’ item in the header and clicking the ‘DevOps’ card you’ll find on the page.

Once in the DevOps section, you will see an overview of all the Projects you have access to.
On top of that list, there is a bar containing various filters and sorting options.
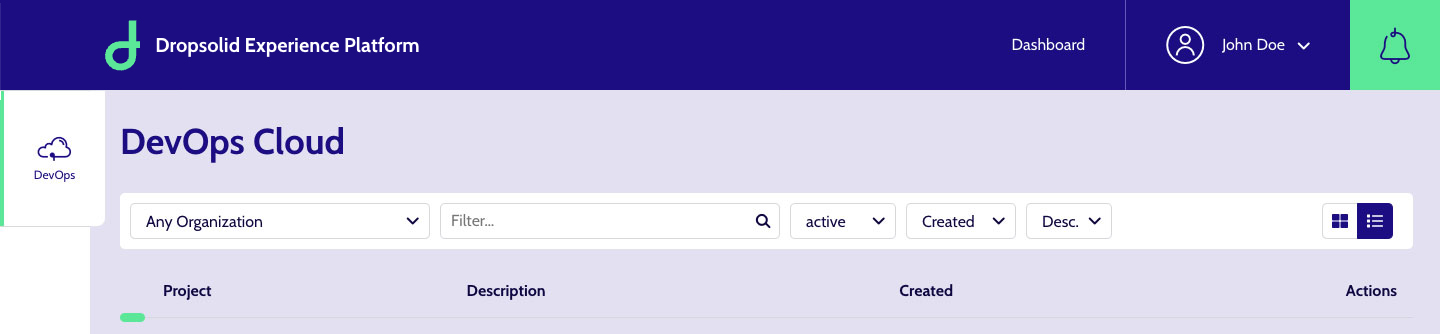
- Organization: If you are a member of multiple ones, the first filter allows you to either display all your Projects (‘any organization’) or just the ones belonging to 1 of them.
- Filter: Typing part of the name (or machine name) of your project, will generate a list list of suggestions for Projects. You can click those names to go directly to a Project, or click open a submenu containing the Environments.
- State. By default, only the active projects are shown.
- Sorting. By default it is set by creation date.
- Sorting direction. By default it is set to be the newest first (descending)
- View: switch between a list and a grid overview of Projects
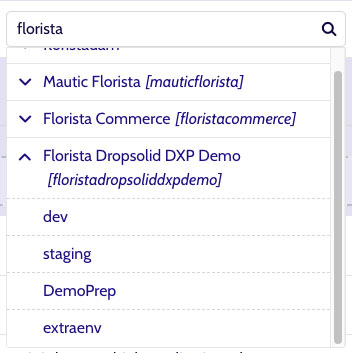
For this example, we’ll try to find the Florista Demo and go to that project. So we simply input the ‘florista’ keyword and this will give us a dropdown list of Projects containing said keyword.
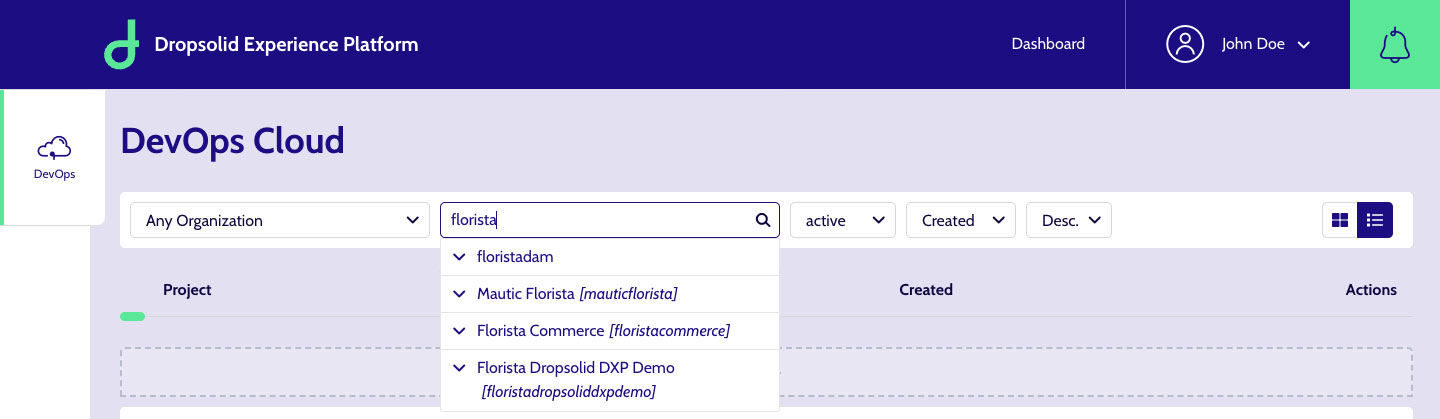
If I wanted to go to a specific Environment of that Project, I can click the arrow icon to reveal that list and click one of those items instead.
We’ll see more about Environments later, let’s go to the Project page instead.
Project
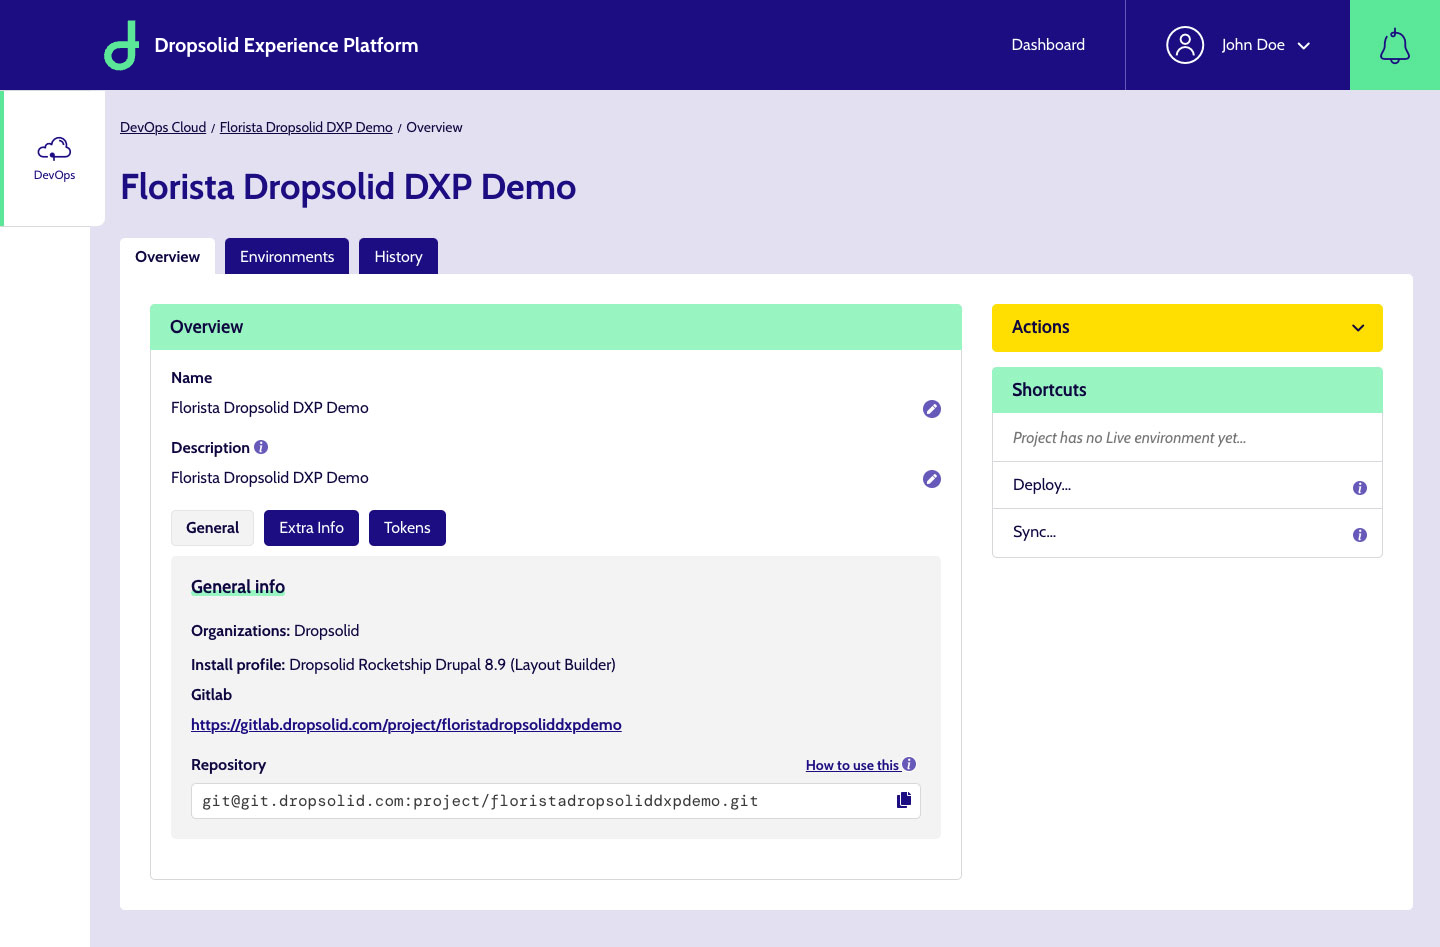
Clicking a Project name (be it in the listing or in the search suggestions), brings you to the Project itself.
There are 3 tabs:
- Overview: the default landing tab, you can see/edit the name and description but there is also a subset of other tabs, all of which aim to give you basic info manage your project, get your project running locally, what organizations own it, …
- Environments: this will show you what environments are active
- History: something like your Notifications History, this displays the tasks that have run that are relevant to this project only.
Sidebar
Besides tabs, there is a sidebar which contains a variety of actions you can perform.
Most of these are relevant to Environments and will be repeated on individual Environment pages as well.
Some of these will not be available in the Project page, if it has no production environment (Live).
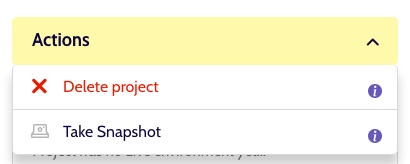
- Actions: they have info-icons that explain the function when you click them
- Delete project (available for users with an Architect role only)
- Take a Snapshot: stores the Project’s repository only, so it’s still possible to recover the data of the Project at a later time. So no database or uploaded files.
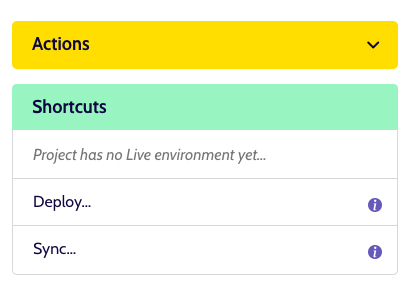
- Shortcuts: actions you use a lot, they have info-icons that explain the function when you click them
- Generate login link (production only)
- Deploy (environment-specific)
- Sync (environment-specific)
- Logs (eg. Apache, Nginx, FPM, …)
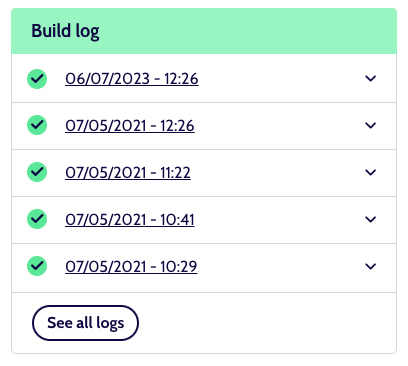
- Build log: lists the deploys that have happened (for production environment), with status and some details (arrow button) and links through to a paged overview with more info
You can see in the screenshot below, that our example Project does not show any other shortcuts besides ‘Deploy’ and ‘Sync’, because it has no Production environment. We will explore the full list of options when we talk about the Environments.
The Project overview also contains a subset of tabs:
- General: this contains a link to the repo’s page in Gitlab, as well as its SSH url
- Extra Info: some meta information, such as the machine name, the deploy method and others
- Cron: if the Project has a Production environment, you will find a list of Crons here. We’ll get more into that as part of the Environments
- Tokens: these can be used for token replacement in the deploy flow. More about that in the Environments section
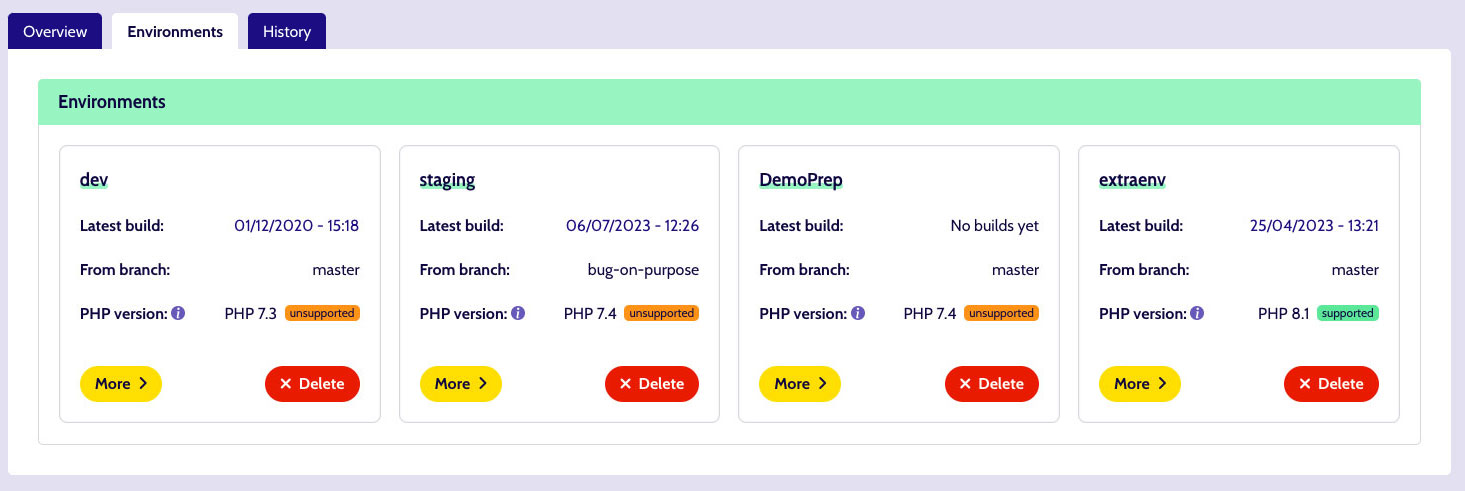
Environments
Here you will find an overview of all the Environments available (active), with some very basic information.
Environment
Once you click through an Environment card, you will get a view very similar to the Project detail itself, including a variety of subtabs.
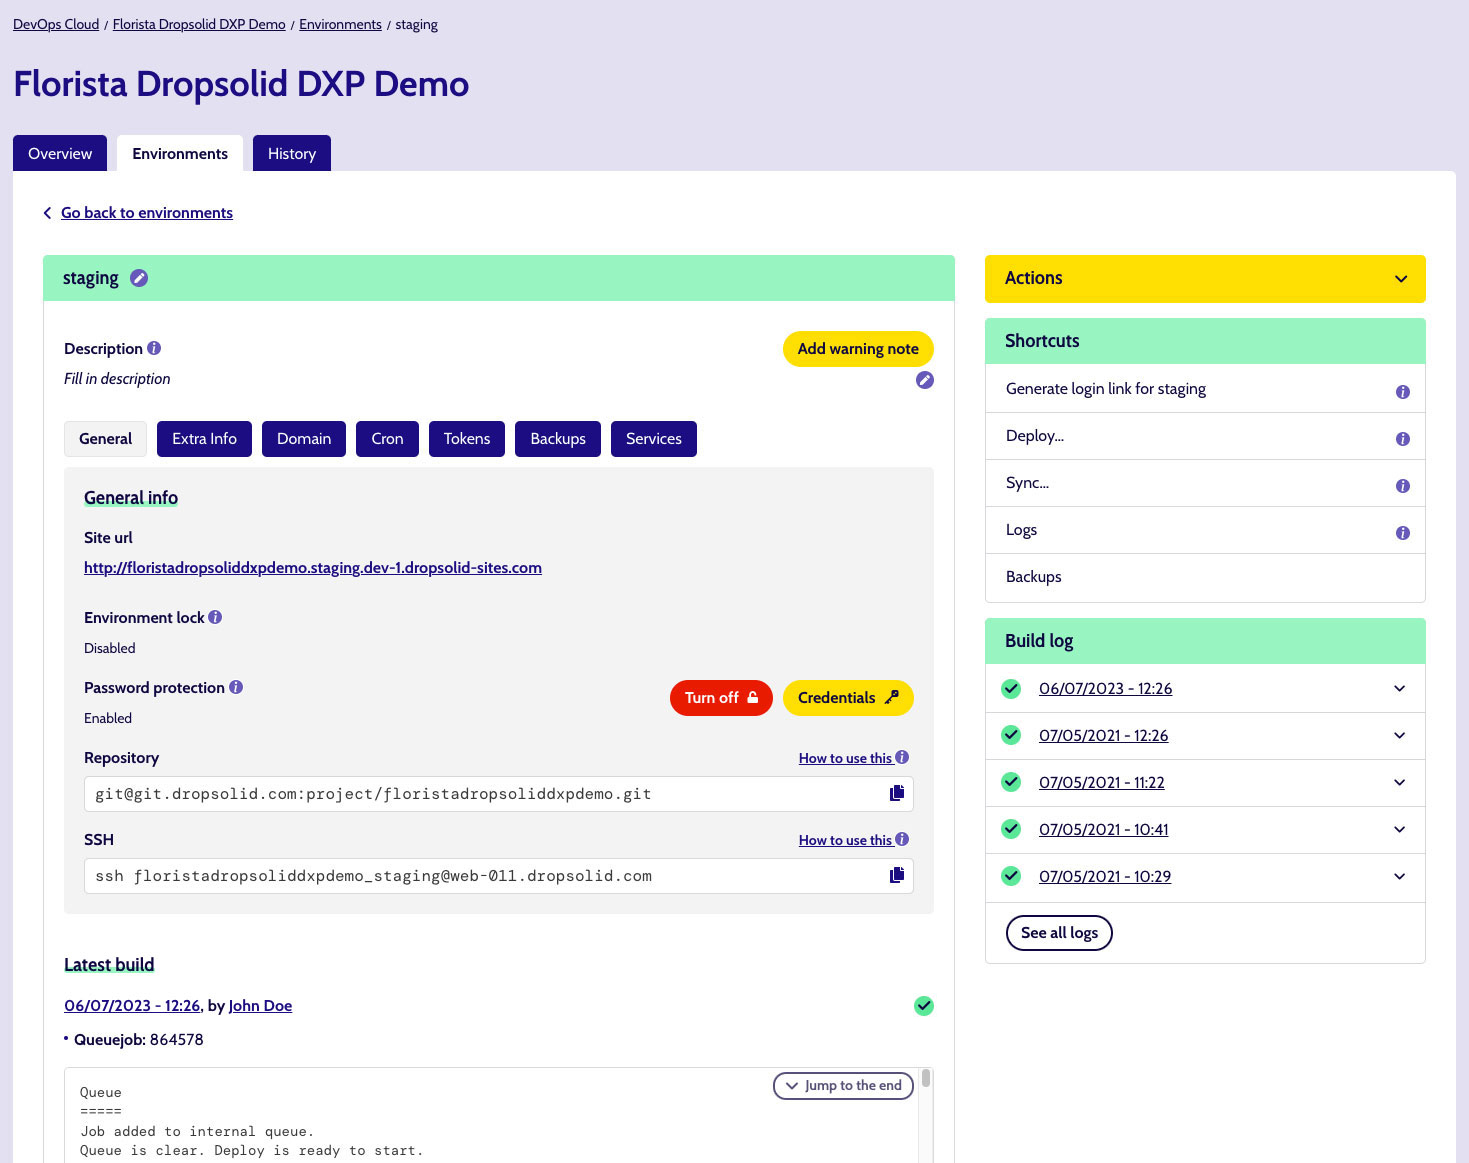
General
Things like the url to surf to, password protection (and the credentials for htpasswd), repo url and SSH command (if you need to access the server).
Warning:
Regarding password protection: some projects have a custom solution (eg. so the API isn’t password protected by the platform protection, but the “regular site” is.
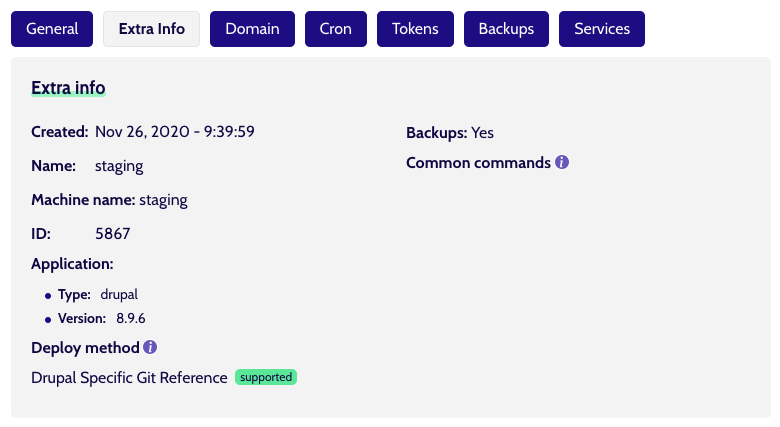
Extra info
All manner of meta information that is useful to know how the environment runs. Creation data, type of application and its version, …
As a bonus, Drupal projects also have a Common Commands item, which tells you how to use Drush aliases to connect to the environment and, for example, sync files or the database.
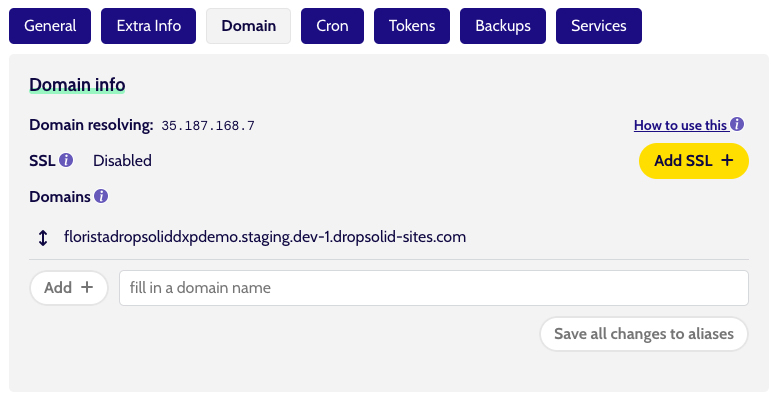
Domain
Here you can manage your SSL, as well as add/remove domains. Info related to these functionalities (eg. set up domains, DNS, …) can be found when clicking the info-icons.
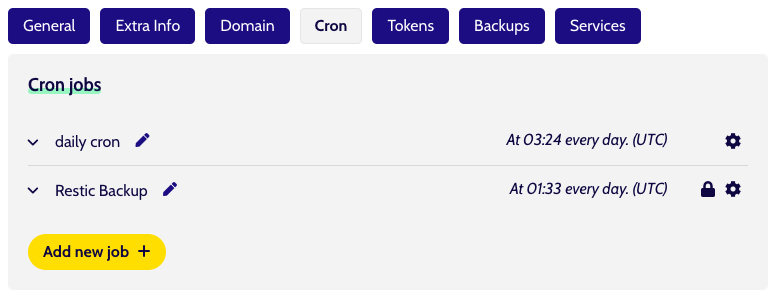
Cron
Manage your cron jobs here, see which ones are active and when they run.
Important to note is that they will run for the first time when they are added.
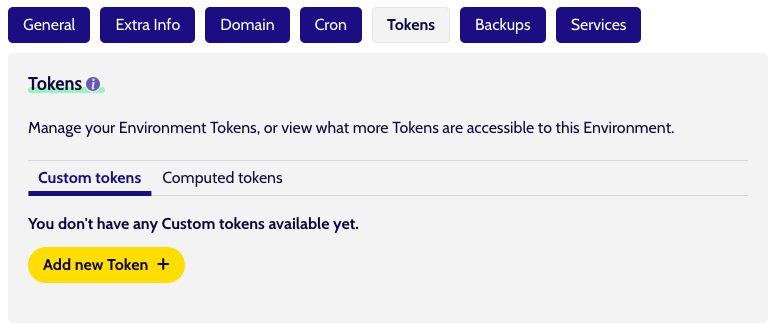
Tokens
Exactly what Tokens are and how they are used, can be found in the support pages (as linked from the component as well).
We have 2 categories here:
- Custom tokens: the ones you add to this environment
- Computed tokens: includes the tokens inherited from the Project and other places and that are available for this environment.
Backups
This shows you the Backups that exist for that Environment, along with options to filter and sort them:
- Filter by type: the scheduled ones are done by cron (daily, weekly, …) and the manual ones are on-demand backups
- Filter using a Date range
- Sort direction (they are already sorted chronologically)
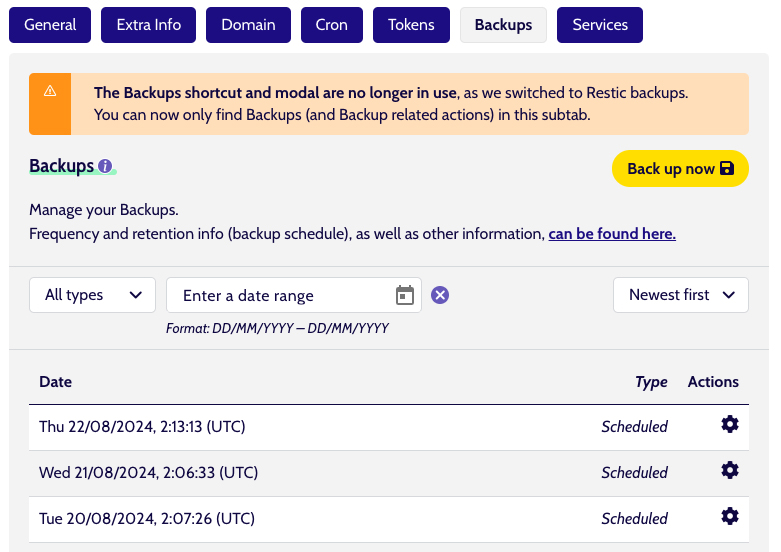
As a Developer, you can also take a new backup (on-demand), as well as choose to download or restore any backup from the list, using the cog-icon.
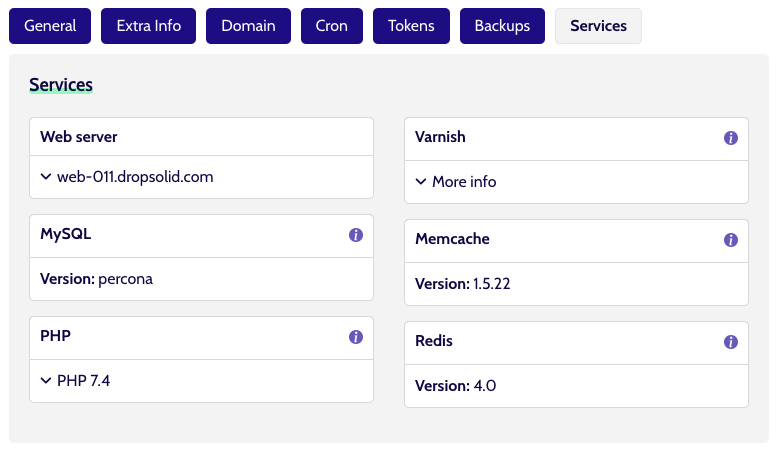
Services
Here you will find information on the various services available, such as PHP (with the active version), Varnish, …
Sidebar
Actions
Just like on the Project page, you’ll find a dropdown with possible Actions. These have a lot more in them. What these all do, can again be read by clicking the info-icon at the right end of each item.
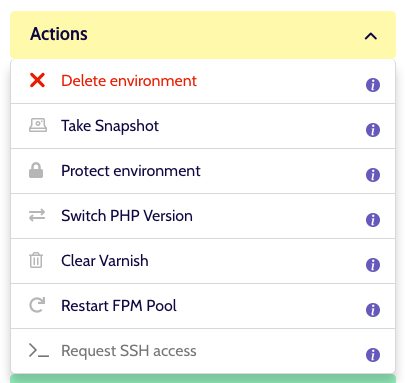
Note: the ‘Request SSH access' action is used to gain access for Production environments only. The other environments should be accessible for you by default, if you use the SSH command provided in the 'General’ tab.
Open Screenshot 2023-06-16 at 14.45.23.png
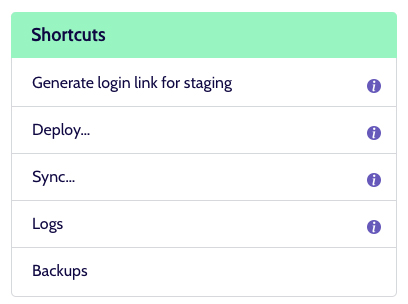
Shortcuts
The sidebar Shortcuts are roughly the same as on the Project detail:
- Generate login link: for Drupal projects only
- Deploy code
- Sync: sync a database between Environments
- Logs: from Apache, Nginx, FPM, …
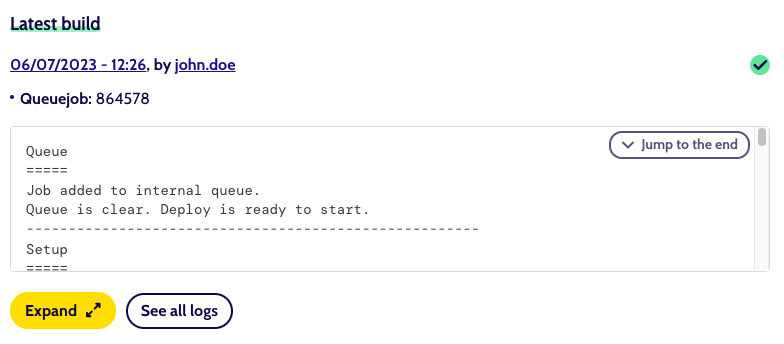
Latest build / Build logs
When deploy code, a notification will pop up to tell you the Environment is being deployed. But if you want more information on what is going on, you should keep an eye on this section.
This will show and update a log, which you can expand and follow along with for information about what is being executed on the server: which commits are being deployed, who made them, …).
Build log
Past logs can also be accessed using the ‘Builds’ component in the sidebar. Each of the entries has its own detail page, with the complete log.